What Industry is in Your Wallet?

Previously I wrote a blog about the differences across the 50 states as measured by manufacturing value added per employee. The differences across the states were quite large and I suggested that much of that variation was a function of the mix of industries in each state. While this mix may not be the absolute predictor for manufacturing growth, it is undoubtedly an important and interesting factor to consider when researching optimal manufacturing efficiency.
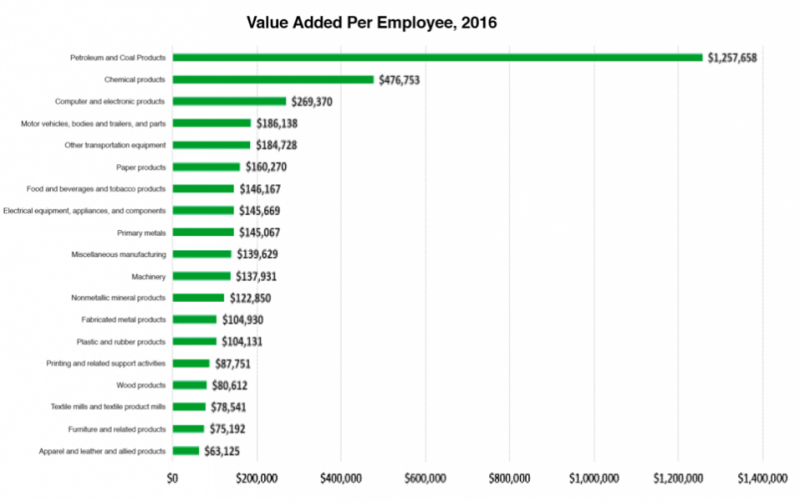
In this blog, I look at productivity (as measured by value added per employee) across a broad set of manufacturing industries. The most productive industry – petroleum and coal products – is about 20 times more productive than the lowest ranked industry – apparel, leather and allied products.
How Manufacturing Industries Compare
Value added per employee across all manufacturing industries in 2016 was just over $175,000. Five industries were above that benchmark and are an interesting mix. If you think about these industries and where they are located, it’s not surprising that those states that are home to these industries would have much higher value added than other states.
The top two industries are related to the petro-chemical industry. The third most productive industry is computers and electronic products and is concentrated in a few states along the west coast with a small handful along the east coast (Massachusetts and North Carolina). However, there is some concern about measurement issues in this industry and thus it may be overstated.
The next two industries involve planes, trains, and automobiles – auto makers, parts manufacturers and other transportation equipment (think aerospace) – and are concentrated in the auto belt starting in Michigan and going down into several states in the Southeast as well as Washington.
There are five manufacturing industries that have value added less than $100,000 per employee. These industries are labor intensive and are subject to intense global competition or serve local/regional markets. The three industries that have the lowest value added per employee are industries that have been hit hard by international competition. Apparel, textiles, and the furniture industry have been particularly challenged over the last few years. The wood products industry – specifically lumber, veneers, pallets/containers, flooring, and other related items (trusses, manufactured homes/structures, millwork) and the companies within it, are challenged to move into higher value added work. The fifth lowest industry – printing and related support activities – is primarily a regional or locally serving industry.
The remaining nine industries include a combination of those involved in servicing local and regional markets such as fabricated metals, machinery, plastics, electrical equipment and food. Others included in this tier are resource-based commodity industries like primary metals, paper and nonmetallic minerals. These industries may be influenced by a different set of factors than the other groups.
 Industries differ in terms of their performance as measured by value added based on productivity. This information has implications for policymakers, MEP Centers, and companies themselves. For companies, this information may begin to serve as a benchmark for looking at their performance, although more detailed information is needed, it may still provide some rough measures. For policy makers, thinking about what manufacturing industries they choose to nurture and support should be based on understanding the portfolio of industries that comprise their state, regional, or local economy and the external factors that influence and affect industry performance and competitiveness. This may also include focusing on the critical elements that enable and support industries from infrastructure, human capital and the eco-system to innovation, new products, and ultimately company competitiveness. For Centers, this data may suggest a set of crude benchmarks that they could use with companies to gauge their performance and establish a path forward to optimize their performance, and potentially determine which sectors they may want to focus on.